There are two ways to create a visualization. If you are signed in, you can navigate to Dashboard and then select Create a Visualization.

These will remain privately in your account and not be shared until you assign the visualization a team within the editor.

If you are associated to a team, you can select Teams and select Visualizations, scroll until you see Create A Visualization. These will remain private in your teams list and show in your account if you started the visualization. Should you wish to transfer the ownership of the visualizations so they no longer exist in your account, please contact support@stjude.cloud.

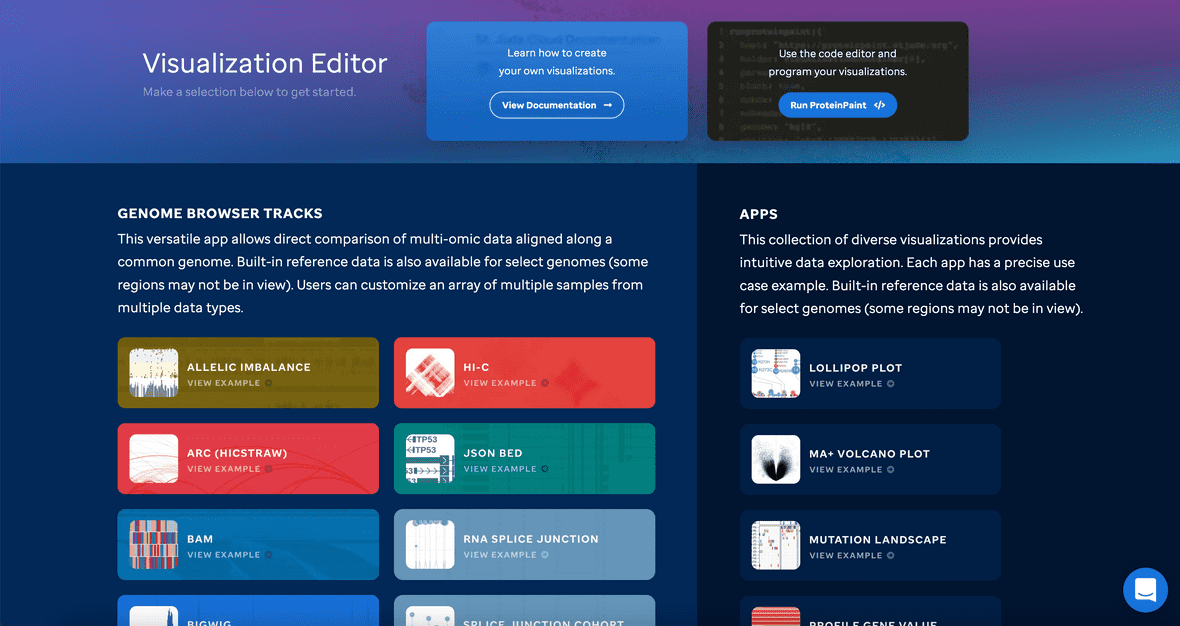
When you begin, you will be navigated to a landing page that allows a user to explore and discover all the available visualizations run by ProteinPaint and GenomePaint.

Select a track or app to begin. For more on the specifics of each, please see our track vs apps section in the left navbar.
tip
You cannot combine tracks with apps. Tracks render our Easy View editor while Apps render our Traditional Code editor.
Both Apps and Tracks are prefilled with example data. Our editors also build the code block as you go if you utilize the Easy View editor. Please note that example data uses spliced files from proteinpaint.stjude.cloud and may show ‘No data in view’ if mixed and matched.
To understand the different track fields read below:
Genome Build - select a genome build that we can support (e.g.: hg19, hg39, mm9, etc). This must be the default to all tracks in a visualization draft.
Position - this is where you want to set your data and refgene view.
RefGene - toggles refgene on or off; you can upload your own in the GenomePaint track.
Track Name - custom to what you want to call that track.
Data (URL/File) - these are keys to access your data files. See the data manage section for more information.
Percentile Max - default to 95, but can be adjusted to adjust scale color
Mode Arc - must be true if mode_hm is false. This turns on the arc and turns off the pyramid.
Pyramidup - default to 1 which is true so the pyramid points up. Otherwise 0 is off and shows the pyramid inverted.
Mode_HM - must be false if mode arc is true. This is for the pyramid setting.
Height - sets max height of the visualization.
Sample - sample reference in file.
Enzyme - restriction enzyme used to cut.
Min Cutoff - setting the threshold for the min cut off of interaction score.
Color - sets visualization color.
Dataset - can be use in Lollipop visualizations. hg19 has Pediatric, COSMIC, ClinVar, and CIViC datasets whereas, hg38 shows GDC, Pediatric, COSMIC, or ClinVar data only.
Once you fill in the fields based on the track selection, you may stack tracks with other tracks.
Features
Sort - sort visualizations according to order.
Delete - delete a track out of the visualization.
(Un)Hide - hide or unhide a track when analyzing certain datasets together. This feature allows you to manipulate your data without losing it.
Copy - copy the same dataset.
Info
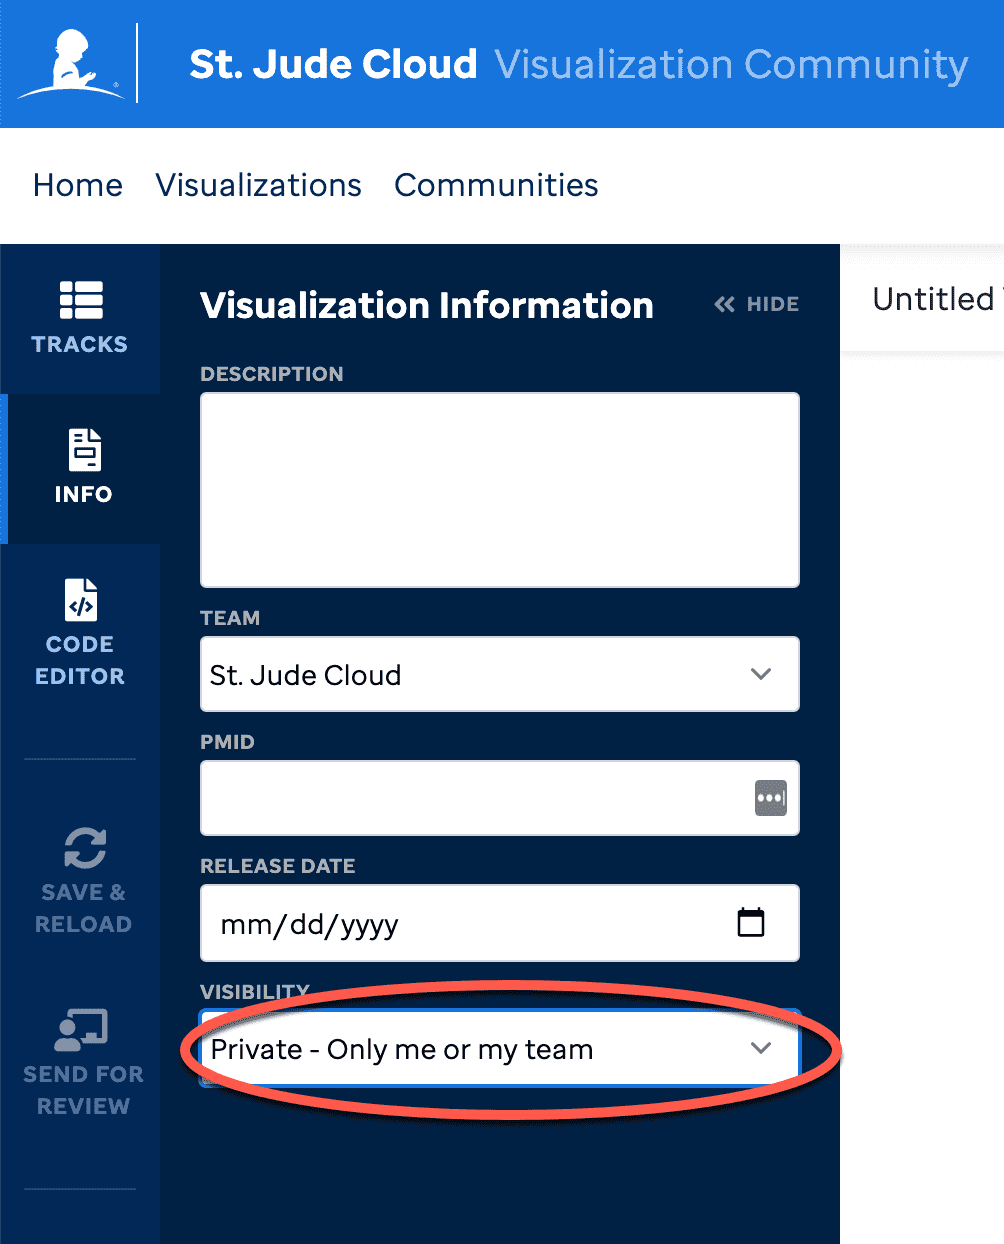
Here is where you can add metadata about the visualization and is required for our approval process. Description - this abstract is needed and will display in Visualization Community see example below:
Team - this allows the visualization to be accessed by the team assigned to. Additionally, the approval process will allow the PI/team lead of this team to approve.
PMID - can be set if there is a paper, but this is not required.
Release Date - date it will be released to Visualization Community.
Data Type - select from our curated metadata list so that it can be added to our database for searching/filtering.
Visibility - enabled once the PI/Team lead approves so that it can remain private (by default) or set to public which publishes to Visualization Community.
Code Editor
This it the traditional code editor for more advanced developers that may want to explore running the proteinpaint() argument. We do have select curated code blocks in our library section. If you choose to code your own visualization with this editor, it must meet proteinpaint’s requirements which can be accessed by going to each code block example and clicking the ProteinPaint documentation hyperlink.
Once the visualization is approved through the review process, if it is toggled to public on the info section of the visualization editor, it will report to support@stjude.cloud to be accepted. We must review the code to ensure there are no security issues.
Save and reload
The visualization editor will save all changes in memory and then once you save it will create a template to access. If you do not save, it will not save the latest changes to your visualization in your account or render the latest changes.
Send for Review
This is our review process where you can send a visualization for review, with a custom message, to the PI/Team lead for the team you associate the visualization to so that they can review the visualization and decide whether to request for revisions or approve. At this time, the visualization is read-only. If the PI/Team lead asks for revisions, then the visualization will show their message and be editable. Throughout the process, the status of the visualization will change accordingly.
By approving, the visualization is still set to private by default. Only when the visualization is approved can the visualization be set to public in the info section by the PI or Team Lead.
This is helpful when a team is proactively curating their visualizations and data for publishing but are not ready to publish to Visualization Community.
tip
Visualizations will change statuses based on where it is in the approval process: Draft - blue; Waiting for review - yellow; Needs Review - red; Revisions requested - red; Approved - green;
Export
Export a SVG of the visualization to use for publications or other related material.
Docs
This will take you to the visualization community help guides.
Advanced customizations for ProteinPaint and GenomePaint are available!