Pediatric Cancer (PeCan) Knowledge Base
Last updated: a year ago (view history), Time to read: 3 minsThe PeCan platform presents curated pediatric cancer genomics data including variants, mutational signatures, and gene expression data in addition to histological slide images* from ~9000 hematological, CNS, and non-CNS solid tumor patient samples.
Data can be explored via a series of data facets containing both retrospective and prospective study cohorts from St. Jude Children’s Research Hospital and other trusted institutions and research centers around the world such as TARGET, DKFZ, and many others. Learn more about the data here. *Note that a number of histological slide images are currently embargoed until publication of the associated study.

Home page
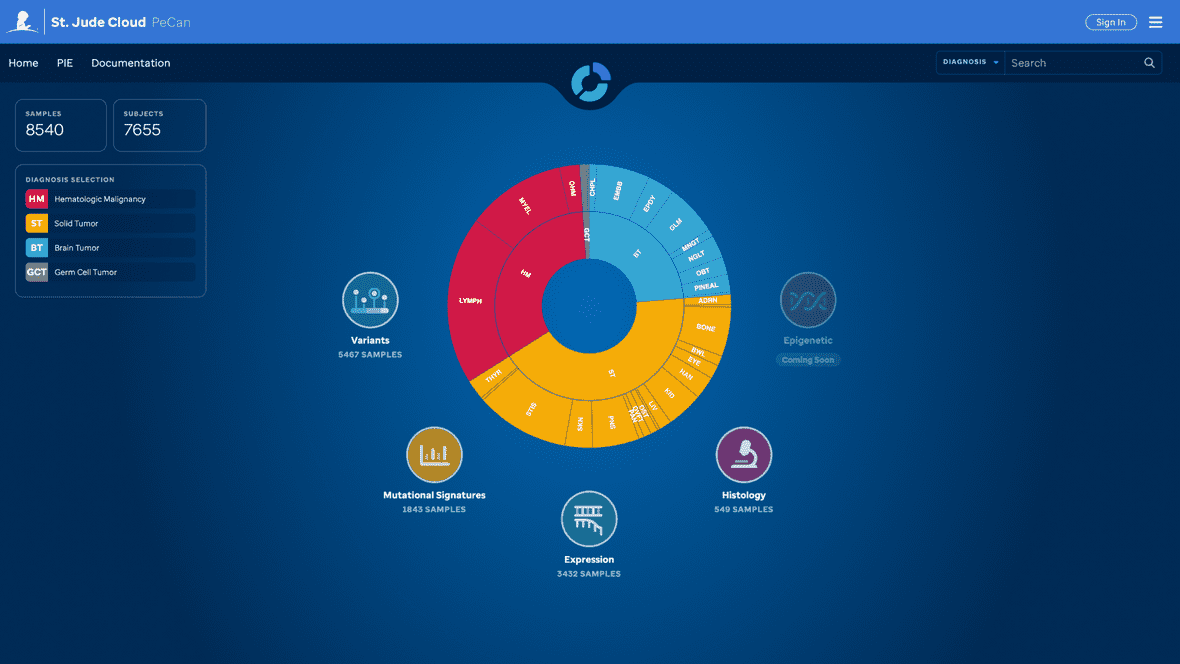
The PeCan home page showcases key components for each of the 4 data facets —Variants, Mutational Signatures, Expression, and Histology—, and the tool: PIE (Pediatric Cancer Pathogenicity variant Information Exchange).
To get started (Figure 1), click our navigational membrane which navigates the user to our sunburst and data facets or search a gene or variant.

Sunburst
The sunburst plot gives an at-a-glance disease distribution and disease hierarchy where all samples have been mapped to a custom ontology (Figure 2). This interactive interface updates as a user selects a diagnoses or subtype within in the sunburst.
The diseases are categorized in three main root categories: 1) HM -Hematopoietic Malignancies, 2) BT -Brain Tumor, and 3) ST -Solid Tumor. A user is encouraged to navigate via a subtype-centric experience by selecting a subtype and then navigate to each data facet for that available data. This will enable custom interface views per data facet based on the sunburst selection. Alternatively, a user can explore all of the available data within a data facet by clicking directly on the data facet icon instead of filtering by subtype on the sunburst.

Data Facets explained
Data Facets represent a distinct type of post-processed genomic data for collections of pediatric cancer samples via a designated interface.
Variants
Visualizations to showcase variant data in an Oncoprint format, Variant Prevalence display, GenomePaint view, ProteinPaint view and designated variant details pages.
Mutational Signatures
Samples depicted via a heatmap where COSMIC mutational signatures in pediatric cancer subtypes were analyzed by WGS.
Expression
An expression landscape of RNA-Seq fresh frozen tumor samples.
Histology
Solid tumor samples that have histology imaging (all H&E).
Tools
PIE (the Pediatric Cancer Variant Pathogenicity Information Exchange
is a cloud-based variant classification and interpretation service.