Overview
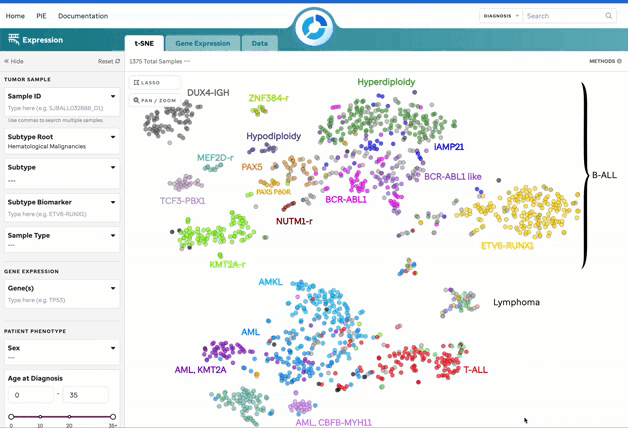
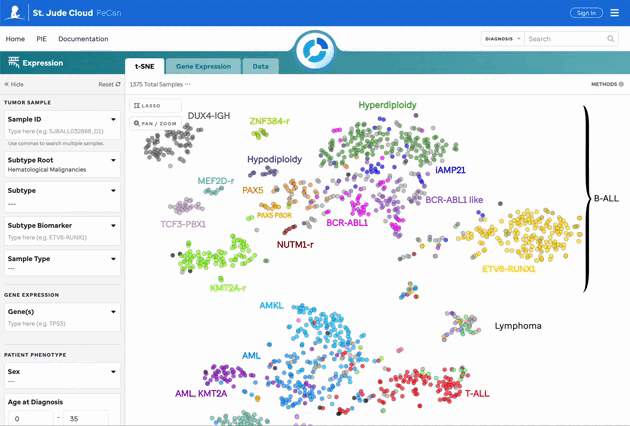
This facet comprises three tabs, allowing users to explore the expression landscape of 3,432 RNA-Seq fresh frozen tumor samples (1,389 blood tumors, 888 solid tumors, and 1,155 brain tumors) using a t-SNE plot (Figure 1), gene expression violin plots organized by subtype for a gene of interest (Figure 2), gene expression overlayed on the t-SNE, or collectively within a data matrix.


Figure 1: t-SNE for Blood, Brain, and Solid Samples. Mouse over data points to access metadata details for each sample. Visualization powered by D3.

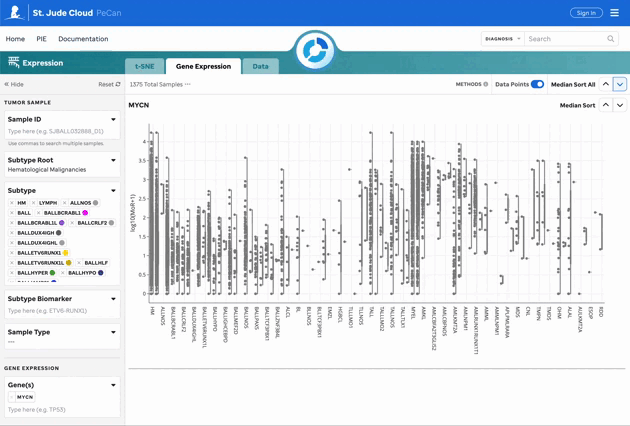
Figure 2: Gene Expression for MYCN. Gene expression violin plots for each sample, filtered by the gene of interest. Visualization powered by Plotly.
Note
- All samples use the hg38 reference genome.
- Full metadata can be accessed through our manifest.
Features for the t-SNE Plot
| Feature | Description |
|---|---|
| Subtype Categorization | Subtypes are color-coded, and a subset is labeled on the plot. These can be turned off in the 3 dot menu. |
| Sample Summary | Clicking a data point opens a drawer with metadata and sample details. |
| Filters | Filters are categorized by Tumor Sample, Patient Phenotype, and Sample Preparation. |
| Sample Search | Search by individual or bulk (comma-separated) sample IDs. CompBio IDs must be exact. |
| Lasso Tool | Select a region on the plot to retrieve a list of samples for further investigation. |
| Pan/Zoom | Zoom in or pan to examine specific regions of the plot. This will disable subtype labels. |
Warning Filtering by the sunburst will auto-populate the Root and Subtype filters. These can be manually edited but will not update the sunburst.
Features for Gene Expression
| Feature | Description |
|---|---|
| Gene Sandbox | Violin plots for the gene of interest, filtered by root and subtypes. |
| Plotly Functions | Pan and zoom features on the right side of the gene sandbox do not affect filter components. |
| Median Sort | Sort the gene expression sandboxes by median expression across or within individual groups. |
| Outlier Toggle | Toggle off data points to keep outliers intact for the cohort currently being filtered. |
For data normalization details, refer to our Methods and Data page.
Gene Expression Overlay on t-SNE
Users can overlay gene expression on the t-SNE plot by selecting genes of interest. Count data is normalized using Median of Ratios (MoR). More details can be found on the Methods and Data page.
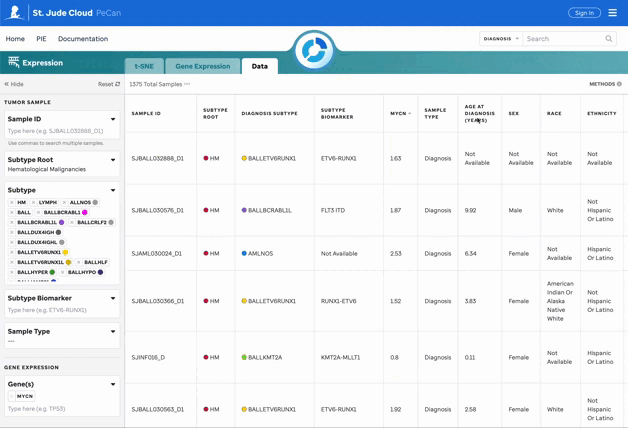
Features for the Data Matrix
The data matrix displays all filtered data with sortable headers for easier exploration.
Filters Explained
Tumor Sample
| Filter | Description |
|---|---|
| Sample ID | Search by individual or bulk St. Jude CompBio IDs (comma-separated). Allows multi-select. |
| Subtype Root | Custom-select a root to prompt applicable subtypes. Heme is defaulted upon loading the facet unless the sunburst is employed. |
| Subtype | Custom-select subtypes to view on the plot. Parent node selection enables or disables child nodes. |
| Subtype Biomarker | Multi-select subtype biomarkers to apply on the plot. General genes like “CTNNB1” are not accepted; users must select biomarkers from dropdown. |
| Sample Type | Multi-select dropdown for sample types. |
Patient Phenotype
| Filter | Description |
|---|---|
| Sex | Multi-select dropdown for biological sex. |
| Age at Diagnosis | Adjustable scale or manual input for age in years. |
| Race | Multi-select dropdown for race. |
| Ethnicity | Multi-select dropdown for ethnicity. |
Sample Preparation
| Filter | Description |
|---|---|
| Library Selection Protocol | Multi-select dropdown for library protocol types. |
| Preservative | Multi-select dropdown for sample preservative types. |
Warning Some fields may have a “Not Available” option for samples where the data wasn’t recorded (e.g., Race, Ethnicity, Sex).
Tip For a subset of this data, refer to Figure 4f of McLeod et al.
To see how the data was calculated and normalized, visit our Methods and Data page.
Page History 1-5 of 22 results
Fixing text: TP53 to MYCN25 days ago
feat(pecan): gene expression added and methods and data updateda month ago
fixed a typo9 months ago
