SEAseq
Last updated: 3 years ago (view history), Time to read: 12 minsOverview
Single-End Antibody SEQuencing pipeline (abbreviated as SEAseq) is a comprehensive automated pipeline for ChIP-Seq/CUT&RUN data analysis. Speaking broadly, it containerizes and joins field-standard, open-source tools for processing raw data and performing a wide array of basic analyses.
SEAseq analyses include alignment, peak calling, motif analysis, read coverage profiling, clustered peak (e.g. super-enhancer) identification, and quality assessment metrics, as well as automatic interfacing with data in GEO/SRA. The easy-to-use and flexibility of SEAseq makes it a reliable and efficient resource for ensuring high quality ChIP-Seq analysis, especially in research environments lacking computational infrastructure or expertise.
Inputs
| Name | Type | Description | Example |
|---|---|---|---|
| Sample FASTQ files | Array of files | One or more Sample FASTQ files. The files are recommended to be gzipped. | [*.gz] |
| Sample SRA run accession identifiers (SRR) | Array of strings | One or more Sample SRR. | [SRR12345678] |
| Input/Control FASTQ files | Array of files | One or more Input/Control FASTQ files. Files are recommended to be gzipped. | [*.gz] |
| Input/Control SRA run accession identifiers (SRR) | Array of strings | One or more Input/Control SRR. | [SRR12345679] |
| Genome Reference | File | The genome reference in FASTA format. | [*.fa] |
| Genome Bowtie indexes | Array of files | The genome bowtie v1 indexes. Should be six index files. | [*.ebwt] |
| Gene Annotation | File | A gene position database file. | [*.gtf, *.gff, *.gff3] |
| Blacklists | File | UHS/DER/DAC or custom blacklist regions file. | [*.bed] |
| Motif databases | Array of files | One or more position weight matrix databases. | [*.meme] |
Input configuration
SEAseq supports FASTQ files and SRA identifiers (SRRs) as Samples Input. A combination of both is also supported.
SEAseq requires the Samples Input, Genome Reference, and the Gene Annotation files be provided.
The Input/Control FASTQ files or SRA ids (SRR) for coverage correction are optional. Bowtie genomic indexes and region-based blacklists are optional.
SEAseq supports Genome Reference and Gene Annotation (or Gene position database) files from most genome repositories, such as UCSC, ENSEMBL, RefSeq or GENCODE.
Outputs
SEAseq provides multiple outputs from the different analysis offerings. Outputs are grouped into subdirectories:
| Name | Type | Description |
|---|---|---|
| BAM_files | Folder | All mapping (.bam) files. |
| BAM_Density | Folder | Reads Coverage profiling in promoter and genic regions matrices, plots and heatmaps. |
| MOTIFS | Folder | Motifs discovery and prediction results files. |
| PEAKS | Folder | Identified narrow peaks, broad peaks and linear-stitched peaks files. |
| PEAKS_Annotation | Folder | Genic annotation of peaks tables and plot. |
| PEAKS_Display | Folder | Normalized signal data tracks in wiggle, tdf and bigwig formats. |
| QC | Folder | Quality statistics and metrics of FASTQs and peaks as tables and color-coded HTML. |
Workflow Steps
- If provided, SRRs are downloaded as FASTQs using the SRA Toolkit.
- Sequencing FASTQs are aligned to the reference genome using Bowtie.
- Mapped reads are further processed by removal of redundant reads and blacklisted regions.
- Read density profiling in relevant genomic regions such as promoters and gene body using BamToGFF.
- Normalized and unnormalized coverage files for display are generated for external browsers such as GenomePaint, UCSC genome browser and IGV.
-
Identification of enriched regions for two binding profiles:
- Identification of stitched clusters of enriched regions and separates exceptionally large regions, e.g. super-enhancers from typical enhancers, using ROSE.
- Motif discovery and enrichment using tools from the MEME Suite.
- Annotation of peaks in genic regions.
- Assessment of quality by calculating relevant metrics including those recommmended by the ENCODE consortium. More information is provided here.
Creating a workspace
Before you can run one of our workflows, you must first create a workspace in DNAnexus for the run. Refer to the general workflow guide to learn how to create a DNAnexus workspace for each workflow run.
You can navigate to the SEAseq workflow page here.
Uploading Input Files
SEAseq requires at least the genome reference sequence, gene annotation and motif database files to be uploaded as input.
Refer to the general workflow guide to learn how to upload input files to the workspace you just created.
Running the Workflow
Refer to the general workflow guide to learn how to launch the workflow, hook up input files, adjust parameters, start a run, and monitor run progress.
Analysis of Results
All results will be organized in the outputs sub-directories as shown in the Outputs Section for easy exploration of results.
Refer to the general workflow guide to learn how to access raw results files.
SEAseq results will be in the parent / folder unless otherwise specified.
Interpreting results
Upon successful run of SEAseq, all files are saved to the results directory as listed in the Outputs Section. Here, we will discuss some of the different output directories in more detail.
Reads Alignment and Filtering
Reads are stringently mapped to reference genome using Bowtie
bowtie -l readlength -p 20 -k 2 -m 2 --best -S.
Mapped BAMs are further processed by removal of duplicate reads using SAMTools and blacklisted regions using bedtools. Blacklisted regions are sources of bias in most ChIP-Seq experiments. These problematic regions are identified as regions with significant background noise or artifically high signal (UHS/DAC/DER), and are recommended to be excluded in order to assess biologically relevant and true signals of enrichment.
Peaks Identification
We identify enriched regions based on two binding profiles; factors that bind shorter regions such as transcription factors using MACS, and for those that bind broad regions such as some histone marks using SICER.
Parameters specified for peak calls :
- Narrow Peaks :
macs14 -p 1e-9 --keep-dup=auto --space=50 -w -S - Broad Peaks :
sicer -rt 1 -w 200 -f 150 -egf 0.86 -g 200 -e 100
In addition, we identify large clusters of enrichment (enhancers) and exceptionally large regions (super-enhancers) using the ROSE algorithm. Computed stitched regions are generated as tab-delimited or BED files with overlapping gene information.
Peaks Display
Coverage graphical files are normalized and generated to be uploaded for display on your choice of external genomic browsers such as UCSC genome browser or GenomePaint in WIG and bigWig format, or IGV in TDF format.
Parameter specified to generate coverage files: macs14 --space=50 --shiftsize=200 -w -S.
Discovery and Enrichment of Motifs
We discover sequence patterns that are widespread and have biological significance using the MEME-ChIP and AME tools from the MEME Suite.
AME discovers known enriched binding motifs. MEME-ChIP performs several motif analysis steps such as novel DNA-binding motif discovery (MEME and DREME), identify motif enrichment relative to background (CentriMo), visualize the arrangement of the predicted motif sites (SpaMO, FIMO).
The motifs are identified using the peak regions and 100bp window around peak summit (-50 and +50).
Reads Coverage Profiling
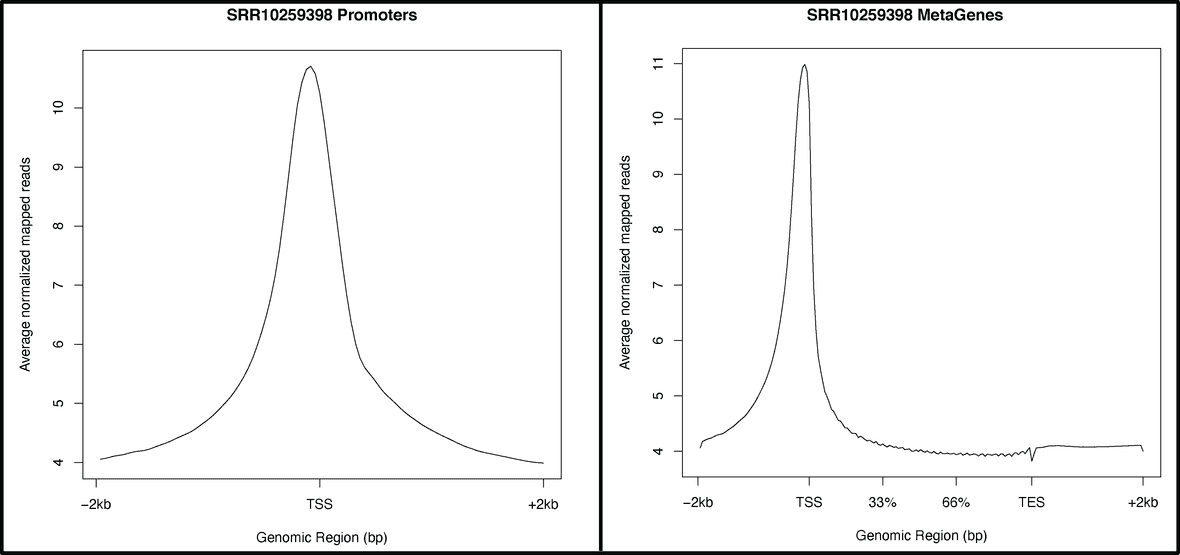
Read density profiling of major genomic regions such as promoters and gene body using BamToGFF.
BamToGFF computes the average read densities of the provided gene coordinates creating a
normalized density matrix file.
The density matrix files are then used to generate coverage graphs and heatmap plots using
a custom R script that will also be provided in the results directory
/BAM_Density/densityplots.R for further customization if needed.
Below is an example of the average read coverage across all promoters and gene body regions for SRR10259398.
Peaks Annotation
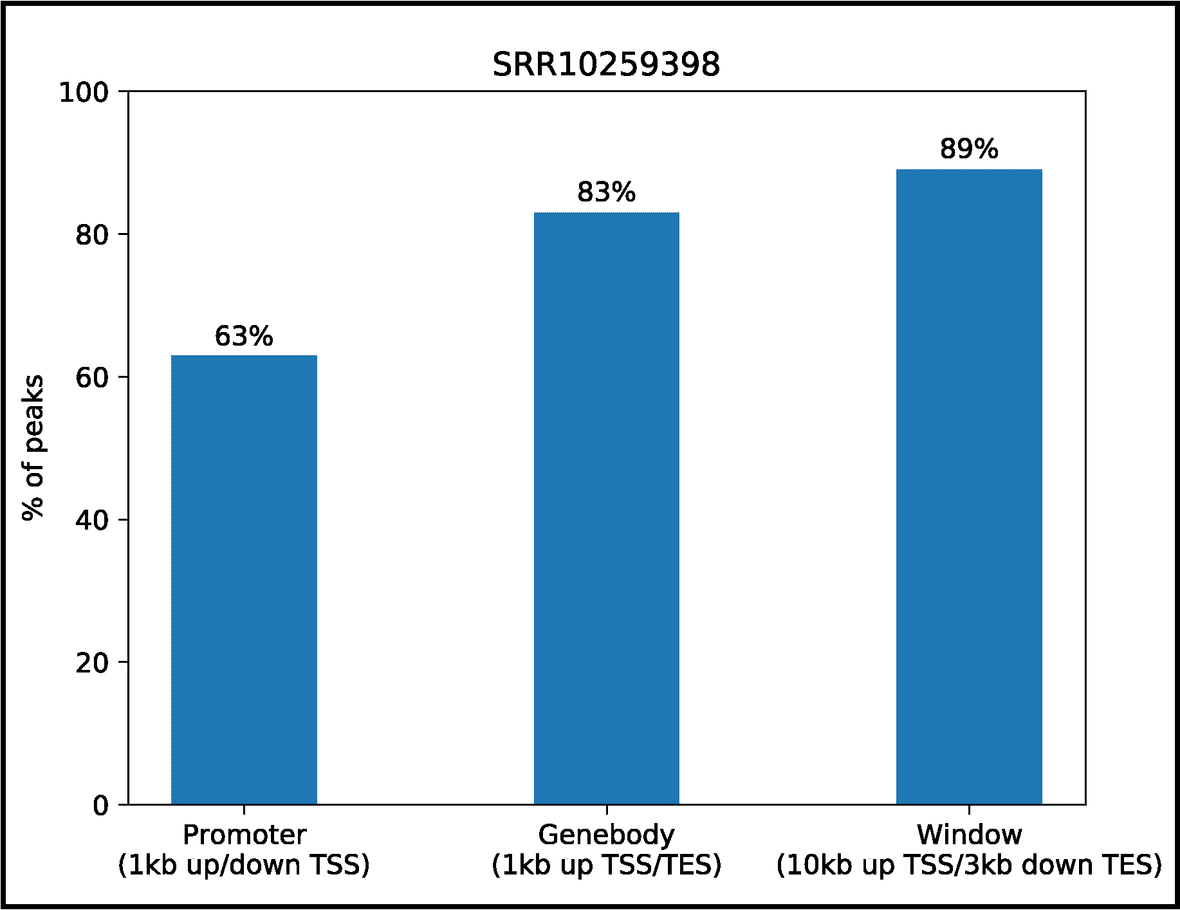
Genic annotation of peaks including promoters, gene bodies, gene-centric windows, and proximal genes. We designed custom scripts to provide this information.
Custom scripts are designed to generate the genic annotation of peaks at promoters, gene bodies and gene-centric windows. Annotated regions are collated to provide a binary overview of proximal genes, and the peaks occupancy percentages are graphically presented in a bar plot as shown for SRR10259398.
QC Metrics
SEAseq provides a vast set of quality metrics for detecting experimental issues, including ChIP-Seq metrics recommended by the ENCODE consortium.
We incorporated a five-scale color-rank flag system to visually identify excellent (score = 2), good (score = 1), average (score = 0), below-average (score = -1) or poor (score = -2) results for each metric in addition to a cross-metric summary score (between -2 and 2), using recommended thresholds where possible.
The metrics are color flagged for easy visualization of overall performance in HTML format as shown for SRR10259398.

SEAseq metrics calculated to infer quality are:
| Quality Metric | Definition |
|---|---|
| Aligned Percent | Percentage of mapped reads. |
| Base Quality | Per-base sequence quality. |
| Estimated Fragment Width | Average fragment size of the peak distribution. |
| Estimated Tag Length | Sequencing read length. |
| FRiP | The fraction of reads within peaks regions. |
| Linear Stitched Peaks (Enhancers) | Total number of clustered enriched regions. |
| Non-Redundant Fraction (NRF) | Fraction of uniquely mapped reads. |
| Normalized Peaks | Peaks identified with Input/Control correction (applicable when Control FASTQ is provided). |
| Normalized Strand-correlation Coefficient (NSC) | To determine signal-to-noise ratio using strand cross-correlation. The ratio of the maximum cross-correlation value divided by the background cross-correction. |
| Sequence Diversity | Sequence overrepresentation. If reads/sequences are overrepresented in the library. |
| PCR Bottleneck Coefficient (PBC) | It is a measure of library complexity determined by the fraction of genomic locations with exactly one unique read versus those covered by at least one unique reads. |
| Peaks | Total number of enriched regions. |
| Raw Reads | Total number of sequencing reads. |
| Read Length | Average FASTQ read length (applicable when multiple FASTQs are provided). |
| Relative Strand-correlation Coefficient (RSC) | A strand cross-correlation ratio between the fragment-length cross-correlation and the read-length peak. |
| SE-like enriched regions (Super Enhancers) | Total number of SE-like clustered enriched regions. |
| Overall Quality | Cross-metric average score. |
Frequently asked questions
If you have any questions not covered here, feel free to reach out on our contact form.
References
None yet!
Similar Topics
Running our Workflows
Working with our Data Overview
Upload/Download Data (local)

